
MIT report finds charter schools continue to excel, assesses the demand for charter seats
October 23, 2013
Boston – A new report by researchers from the School Effectiveness and Inequality Initiative at M.I.T. has found that Boston charter school students continue to significantly outperform Boston Public Schools students across the middle and high school grades on the MCAS. The report, Charter School Demand and Effectiveness, A Boston Update, is the third study of charters undertaken by the SEII researchers in cooperation with the Boston Foundation, and serves as a follow-up to a 2009 TBF report which highlighted the successes of charters relative to pilot and traditional BPS schools. The Boston Foundation and NewSchools Venture Fund provided funding for the data analysis.
“The consistently high performance of charter school students across middle and high school grade levels in Boston is one of the brightest stories of innovation in education in the country,” said Paul S. Grogan, President and CEO of the Boston Foundation. “But charter schools must redouble their efforts to connect with ELL and Special Education communities that the report shows are even more likely to excel in a charter environment.”
Sarah Cohodes and Chris Walters of the School Effectiveness and Inequality initiative at the Massachusetts Institute of Technology, led a team of researchers who collected available charter lottery information and matched lists of charter applicants to state education databases to better understand charter demand and the performance of those students who attended charters. The methodology tracks winners and losers in the charter lottery when examining student performance to make “apples to apples” comparisons that capture the causal effect of charter attendance.
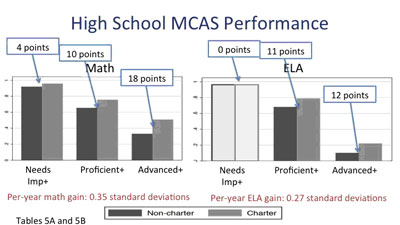
In middle school, the researchers found a gain in MCAS proficiency of 12 percentage points in math and 6 percentage points in ELA per year of charter middle school attendance. In charter high schools, the proficiency gain is around 10 percentage points per year for both subjects.
“The MIT analysis shows that attending a charter school in Boston has dramatic effects on MCAS performance and proficiency rates,” said James Peyser, managing partner for city funds at the NewSchools Venture Fund. “The cumulative effects in some cases fully close the achievement gap between Boston students and their suburban peers.”
The researchers found that students are increasingly likely to apply to charter schools, and at the middle school level, competition for charter places has increased substantially over the past four years. At the high school level, demand is up less sharply, as charters are chosen as one piece of a portfolio of options for entering 9th grade students. The researchers found that in recent years, charter student demographics have moved to more closely match those of the Boston Public Schools, but important gaps remain. Because many offers of a charter seat come after parents have made other commitments, the overall take-up rate for charter offers is lower than expected.
“Boston’s charter school students generally mirror their BPS peers in terms of income status, race and ethnicity, with somewhat fewer special needs students and a larger gap among English Language Learners,” noted Peyser. “The demographic differences that still exist have narrowed significantly since the passage of education reform in 2010.”
“An Act relative to the Achievement Gap”, which was signed by Governor Patrick in 2010, included provisions that for the first time gave Commonwealth charter schools access to the district’s student lists, in order to improve student outreach, as well as requiring charter schools to report on their student recruitment and retention efforts on an annual basis.
In their examination of student retention, researchers found that since 2010, charter and district schools show no difference in retention over time, with charters keeping significantly larger percentages of their students than BPS schools at the middle school level.
“Charter schools in Boston continue to put up performance that is impressive across grade levels and student groups,” said Cohodes, who is currently a doctoral candidate at Harvard University’s John F. Kennedy School of Government. “Our research shows that charters are seen as a strong and increasingly popular element of the portfolio of quality options for students, especially at the middle school level.”
Affirmed: Charter schools drive student outcomes
The research reaffirmed a 2009 report from SEII and the Center for Education Policy Research at Harvard University that found charter students significantly outperformed peers who did not gain entrance to a charter school through the charter lottery – and that the longer a student remains in a charter school, the greater the increase in their likelihood of scoring highly on the MCAS. Using a series of analyses to determine the annual effect of charter attendance on MCAS performance, the researchers found that charter attendance significantly increases the likelihood that a student will score proficient or higher on the Math and ELA MCAS at both the middle and high school levels.
The middle school charter gain in MCAS proficiency is 12 percentage points in math and 6 percentage points in ELA per year of attendance. For high school, the proficiency gain is 10 percentage points in math and 11 percentage points in ELA. Similar changes can be seen among students scoring advanced or higher. Attending a middle school charter improves those rates by 7 percentage points in math and 3 percentage points in ELA per year. Effects are very large in high school. About a third of non-charter students meet the advanced level in math and 10 percent do so in ELA. The charter effect adds 18 and 12 percentage points per year of attendance to each of those subjects, respectively.
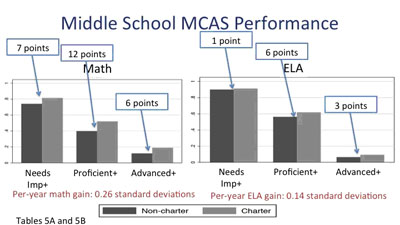
The researchers also estimated the cumulative impact of charter attendance for middle school MCAS scores, and found that these per-year effects may accumulate over time and across grade levels, though it is not possible to separately estimate effects for each incremental year of attendance. By grade 8, the middle school proficiency gap between the charter and non-charter students had risen to more than 30 points in math, and more than a dozen percentage points in ELA.
The researchers focused on charter schools that were able to provide lottery data between 2003 and 2012 – capturing 87 percent of charter students in recent years. Charters that provided incomplete data or had been closed were excluded from the lottery analysis. However, in a “non-lottery” analysis that included those schools, researchers found that while the closed schools had a much lower impact on student performance, their presence did not change the findings that charter students significantly outperformed their BPS peers on the MCAS at both the middle and high school levels.
Understanding charter school demand and demographics
The research team also looked at a new area in the 2013 report – charter demand. Rather than examining individual school waitlists, which are in some cases rolled over year-to-year and may contain large numbers of duplicates, the research team identified unique first-time applicants for seats at a large set of schools and traced the pattern of offers and enrollment this list generates.
The researchers found that charter application rates grew over the study period. Between 2009-2010 and 2012-2013, the percentage of 6th graders applying to at least one charter rose from 15% to 33%; 9th grade applicants rose less sharply – from 11% to 15%. This resulted in an increase from 2 to 3 applications for every available charter seat in middle school by 2012-2013, and from 3 to 4 applications for each 9th grade seat.
Despite large and rising ratios of charter applicants to seats, however, a majority of applicants to Boston charter schools received either initial offers to attend immediately after the lotteries or were accepted from one or more waiting lists during the study period. Between 2009-2010 and 2012-2013, slightly over 50% of middle school charter applicants were eventually offered seats, while 69% of high school applicants eventually received offers. The middle school offer rate fell over time, from 66 % in 2009-2010 to 41% in 2012-2013, while the high school rate stayed roughly constant over this period.
A parallel examination of offers and take-up rates found that the odds of receiving a charter offer are roughly comparable to the chances of receiving a first-choice assignment in the BPS school assignment process, which uses a computer algorithm to match students to schools based on their preferences. The BPS first-choice offer rate is somewhat higher than the charter offer rate in middle school (68 vs. 55 percent), and lower in high school (55 vs. 70 percent). Offer take-up rates are lower in charter schools than in the BPS mechanism. Three-fourths of BPS students accept offers to attend their first-choice schools, compared to 60 percent in charter middle schools and 30 percent in charter high schools – a difference explained in part by the higher frequency of waitlist offers in charter schools, which are less likely to be accepted than initial offers.
Demographic differences between charters and other Boston public schools
The SEII team also looked at the demographics of charter applicants and charter students. Charter students are less likely to have special education or ELL status, though the gap in application rates by special education status is rapidly decreasing. The researchers noted that charter schools have enrolled larger numbers of English language learners in recent years, but the gap with BPS is still sizable. Researchers noted that the demographic gaps reflect demographic differences in the students applying to charters and are not caused by selective admission of applicants (the latter is determined by random lotteries).
Demographic gaps began to close more substantially after the passage of the 2010 Achievement Gap Act in Massachusetts, which increased the charter cap but also called on charters to reach out more aggressively to ELL and special education students. At the same time, charters were given access to the BPS student list, making it easier to reach out to demographic groups that were not previously well represented in charter student bodies.
Charters and Boston public schools served similar shares of non-white students throughout the study period, and by 2012-2013, charters and BPS schools served similar numbers of low-income students as well.
An interesting demand/effectiveness paradox
The researchers noted that demographic groups that saw the largest gains in MCAS performance were often those least likely to apply to charter schools in the first place – among them, ELL and special education students, who are underrepresented in charter school student bodies yet enjoy sizable gains when they do enroll in a charter school.
The impact of school switching
Lastly, the researchers performed a descriptive analysis of school switching to examine the claim by some critics that that charter school MCAS effects are due to “selective out-migration” of students. This analysis found that both charter and BPS students are highly mobile. But taken as a whole, charter students are more likely to remain in the same school than BPS students.
At the middle school level, even excluding switches to Boston exam schools, which the researchers found was far more common for those attending BPS schools than at charters, middle school charter students stay in the same school at a rate higher than their peers in non-charter schools.
At the high school level, researchers found that charters were less likely to retain their 9th grade students through to 12th grade prior to 2010. Since 2010 and the passage of the Achievement Gap Act, high school charters are retaining students at the same rate as their BPS counterparts. This may be an indication that high school charters responded to the law change by retaining more students.
******
The Boston Foundation, Greater Boston’s community foundation, is one of the oldest and largest community foundations in the nation, with net assets of more than $900 million. In 2012, the Foundation and its donors made $88 million in grants to nonprofit organizations and received gifts of close to $60 million. The Foundation is a partner in philanthropy, with some 900 separate charitable funds established by donors either for the general benefit of the community or for special purposes. The Boston Foundation also serves as a major civic leader, provider of information, convener and sponsor of special initiatives that address the region’s most pressing challenges. The Philanthropic Initiative (TPI), an operating unit of the Foundation, offers special consulting services to philanthropists. Through its services and its work to advance the broader field of strategic philanthropy, TPI has influenced billions of dollars of giving worldwide. For more information about the Boston Foundation and TPI, visit www.tbf.org or call 617-338-1700.