GBHRC 2021: Town-by-town housing market data
Local Housing Market Data
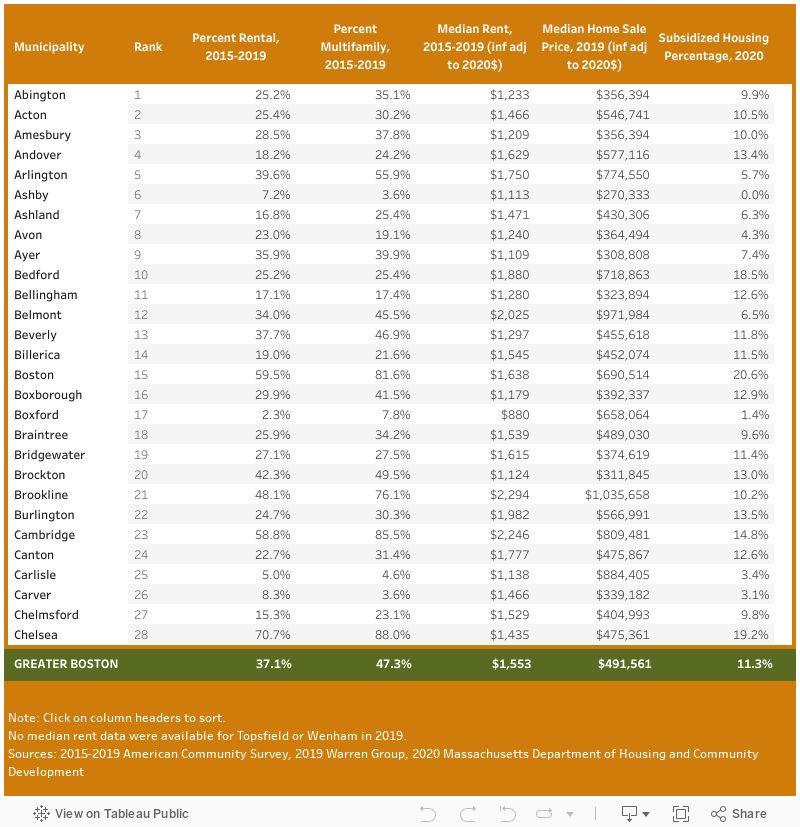
The chart below includes key housing data for 147 Greater Boston communities, including percent rental housing, percent multi-family housing, median rent and home sales prices, and percentage of housing that is subsidized.
For historical comparison, many of the same data were reported in the interactives for the 2019 Greater Boston Housing Card. Find those interactives here.